Benchmarking Document AI: OmniDocBench, PubTabNet, CISOL, TabRecSet
Document AI has exploded in capability over the past two years, but reproducing published claims still hinges on solid evaluation practices. I condensed my benchmark research notes into this guide so it’s easier to see which datasets cover which scenarios, what metrics they report, and how to interpret their numbers. Use it as a reference when you build or compare OCR, table, or layout systems.
Table of Contents
OmniDocBench
OmniDocBench is the most comprehensive public benchmark I’ve found for modern PDF parsing. It evaluates everything from layout recovery to formula recognition with detailed attribute tags for slicing performance.
Dataset: types, scale, and diversity
- Nine document genres such as academic papers, exam papers, newspapers, financial reports, slides, and handwritten notes.
- 1,355 curated PDF pages (v1.5 on GitHub) that mix four layout archetypes and three languages (English, Chinese, and hybrid cases).
- Rich annotations: 20k+ block-level boxes, 70k+ span-level annotations, LaTeX and HTML tables, five page attributes, three text-block attributes, and six special table flags.
- Reading order metadata makes linearization analysis possible.
Annotation workflow and quality control
- Intelligent pre-annotation from existing layout/OCR tools.
- Human annotators refine bounding boxes, text content, ordering, and metadata.
- Expert reviewers run quality checks, especially for noisy scans or watermark-heavy pages.
- Attribute tags capture troublesome artifacts (faded scans, watermarks, handwriting) so you can stress-test models deliberately.
Benchmark methodology
- End-to-end evaluation: treat the pipeline as a black box (PDF → Markdown/HTML/JSON).
- Module-level evaluation: isolate layout detection, OCR, table parsing, formula recognition, and reading order.
- Attribute analysis: break down results per document type and per block/table attribute.
Matching and metric highlights
- Text/OCR: normalized edit distance (NED) plus BLEU/METEOR for optional linguistic scoring.
- Tables: Tree-Edit-Distance-based Similarity (TEDS) and TEDS-S for fast structural-only checks.
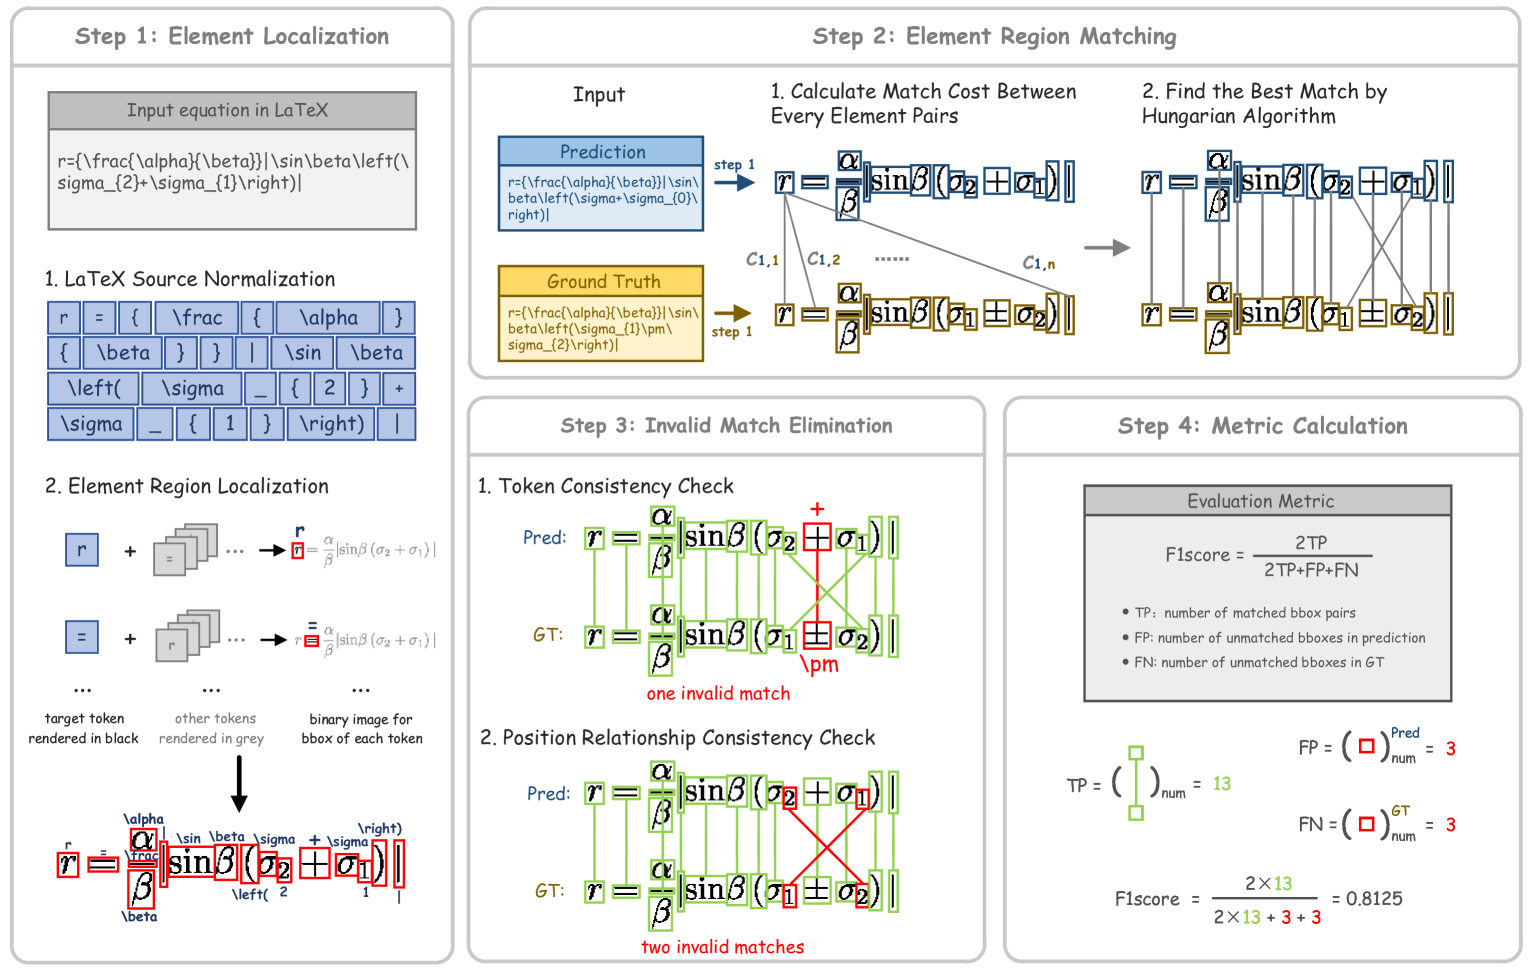
- Formulas: Complex Document Matching (CDM) aligns LaTeX structures while tolerating equivalent expressions.
- Reading order: edit distance on the predicted vs. ground-truth block sequence.
- Overall: mean of
(1 − NED) × 100, table TEDS, and formula CDM.
Results snapshot
| Method | Overall | Text (ED) | Formula | Table | RO (Edit) |
|---|---|---|---|---|---|
| MinerU2.5 (1.2B) | 90.67 | 0.047 | 88.46 | 88.22 | 0.044 |
| MonkeyOCR-pro-3B | 88.85 | 0.075 | 87.25 | 86.78 | 0.128 |
| dots.ocr (3B) | 88.41 | 0.048 | 83.22 | 86.78 | 0.053 |
| MonkeyOCR-3B | 87.13 | 0.075 | 87.45 | 81.39 | 0.129 |
| MonkeyOCR-pro-1.2B | 86.96 | 0.084 | 85.02 | 84.24 | 0.130 |
PubTabNet
PubTabNet is the go-to dataset for image-based table recognition when you only have raster inputs instead of PDF markup.
Dataset overview
- ~568k table crops extracted from PubMed Central Open Access articles.
- Each image pairs with a ground-truth HTML tree that encodes layout (rows, columns, spans) and non-empty cell text.
- Automatic alignment between article XML and PDF ensures consistent crops.
- Cells carry header/body labels for downstream semantic tasks.
- Compared to SciTSR or TableBank, PubTabNet offers more diverse layouts and explicit structure + content annotations.
TEDS: Tree-Edit-Distance-based Similarity
Represent tables as HTML trees:
<table>
  <tr><td>Apple</td><td>Banana</td></tr>
  <tr><td>Cherry</td><td>Date</td></tr>
</table>
Allowed operations (insert, delete, replace nodes) transform the predicted tree into the reference tree. The similarity score is:
TEDS = 1: perfect structural + textual agreement.TEDS = 0: completely mismatched.- TEDS-S keeps the same idea but ignores small text differences when only structure matters.
Model and results
- Encoder–Dual-Decoder (EDD): a CNN encoder feeds two interacting decoders—one for HTML structure, one for cell text.
- The structure decoder triggers the cell decoder whenever a
<td>appears, helping align visual regions with textual generation. - Joint training on structure and text yields ~9.7 percentage-point absolute improvement in TEDS over prior SOTA.
- Ablations show better handling of merged cells and low-contrast text, though extreme distortions remain challenging.
CISOL
CISOL (Construction Industry Steel Ordering Lists) targets an underserved domain: engineering/construction documents filled with tables, drawings, and irregular spans.
Dataset
- 120k+ annotated table instances from ~800 industry documents.
- Labels cover table detection, table structure recognition (rows, columns, spanning cells), and header/body semantics.
- Polygon-style annotations help with tables embedded inside schematics or surrounded by distractors.
- Annotation quality verified via a K–α consistency measure.
Metrics
- Table detection: COCO-style
mAP@0.5:0.95:0.05. - Table structure recognition: structural overlap against annotated rows/columns/spans.
- Analysis: IoU sweeps expose how sensitive each model is to localization accuracy.
Baseline results
- YOLOv8 tuned for CISOL reaches
67.22 mAP@0.5:0.95:0.05, surpassing the TSR-specialized TATR model in this domain. - Qualitative examples reveal hard cases: tables nested within tables, spanning cells draped over embedded diagrams, and heavy distractors.
TabRecSet
TabRecSet is built for end-to-end table recognition “in the wild,” spanning both English and Chinese documents with significant geometric distortions.
Dataset
- 38,100 table instances total: ~20.4k English and ~17.7k Chinese.
- Includes border-complete/incomplete, rotated, skewed, camera-captured, and scanned tables.
- Each annotation contains a polygon for the table body, cell-level logical layout, and cell text (when present).
- Source documents range from invoices and spreadsheets to exams and handwritten forms.
Metrics
- Table Detection (TD): polygon-based IoU plus standard detection metrics.
- Table Structure Recognition (TSR): compare predicted layout graphs against annotated cells/spans.
- Table Content Recognition (TCR): measure text accuracy per cell, often with edit-distance variants or HTML comparisons.
- Combined evaluation rewards pipelines that nail detection, layout, and OCR simultaneously.
Baseline results
- Off-the-shelf pipelines struggle on rotated or heavily skewed layouts, with larger drops for Chinese tables.
- The published baselines act as minimums to beat; the authors explicitly invite better geometric-normalization strategies and multilingual OCR models.
Proposal Benchmark Playbook
Most document problems reduce to detection, structure, content, and a fused end-to-end view. Here’s how the field measures each layer.
Level 1: Detection metrics
Precision, recall, and F1 use overlaps between predicted and ground-truth regions:
mAP@IoU (e.g., 0.5:0.95:0.05) summarizes detection quality across IoU thresholds—standard for COCO-style evaluations.
Level 2: Structural metrics
- TEDS (from PubTabNet) compares predicted vs. ground-truth HTML trees.
- Reading-order edit distance evaluates how well the block sequence matches reference ordering.
- Matching-based IoU aligns predicted and labeled blocks/spans before scoring downstream text quality.
Level 3: Content metrics
- Levenshtein distance counts the minimum edit operations to transform prediction into reference.
- Normalized Edit Distance (NED) rescales Levenshtein to
[0, 1]. - BLEU and METEOR report n-gram precision/recall for longer-form text.
- Formula metrics (CDM) align LaTeX expressions by combining spatial matching and symbolic checks.
Levenshtein pseudocode
for i in range(len(a) + 1):
    D[i][0] = i
for j in range(len(b) + 1):
    D[0][j] = j

for i in range(1, len(a) + 1):
    for j in range(1, len(b) + 1):
        cost = 0 if a[i-1] == b[j-1] else 1
        D[i][j] = min(
            D[i-1][j] + 1,      # deletion
            D[i][j-1] + 1,      # insertion
            D[i-1][j-1] + cost  # substitution
        )

return D[len(a)][len(b)]
Normalized Edit Distance
BLEU
METEOR
Level 4: End-to-end scoring
- OmniDocBench Overall:
- Weighted fusions: other works raise or lower the weight of text, layout, or content depending on document types (slides vs. reports).
- Module-wise dashboards: publishing per-document-type and per-attribute results uncovers blind spots (e.g., VLMs collapsing on slides, OCR failing on watermarked tables).
References
- OmniDocBench: Benchmarking Diverse PDF Document Parsing with Comprehensive Annotations
- A Large-Scale Dataset for End-to-End Table Recognition in the Wild
- CISOL: An Open and Extensible Dataset for Table Structure Recognition in the Construction Industry
- Image-based Table Recognition: Data, Model, and Evaluation
- CDM: A Reliable Metric for Fair and Accurate Formula Recognition Evaluation